Translation Agency KPIs Dashboard: 12 Metrics Every LSP Owner Must Track
Key Takeaways
- Translation agency owners must track 12 core KPIs across four pillars: quality, delivery speed, financial health, and client success to maintain control of their business.
- A simple KPI dashboard updated weekly for operations and monthly for financial metrics is sufficient for most language service providers to stay on track.
- The right translation KPIs connect day-to-day work to revenue growth, gross margin, and client retention—not just total words translated or project counts.
- This guide is written from the perspective of an LSP owner who has tested these measurable values in real agency environments.
- Concrete KPI formulas and 2026 benchmark targets are provided throughout to make implementation immediately actionable within 30 days.
Why Translation Agency KPIs Matter in 2026
From 2020 to 2026, falling per-word prices, widespread machine translation adoption, and rising client expectations around speed and terminology consistency made KPI tracking non-optional for translation agencies. Running blind is no longer viable in this environment.
Key performance indicators for agencies extend far beyond single translation project metrics. They must cover production quality, delivery speed, client outcomes, sales performance, and financial health. Without this broader view, you cannot identify which segments of your business actually generate profit.
A small or mid-size LSP operating without translation KPIs risks accepting low-margin work just to keep utilization high. Project managers become overloaded. Early churn signals from unhappy clients go unnoticed until revenue has already dropped. Quality issues compound without anyone tracking the pattern.
Vanity metrics like total words translated or number of jobs completed look impressive in reports but reveal nothing about profit erosion, regulatory risk, or capacity limits. These outputs feel productive while your margins quietly collapse.
The rest of this article maps out a 12-metric dashboard that any LSP owner can implement within 30 days. You will get specific formulas, industry benchmarks, and practical targets that work in 2026 market conditions.
The 4 KPI Pillars for Translation Agencies
The 12 translation KPIs fall under four pillars that structure your dashboard and make tracking manageable:
- Quality – Are we delivering reliable translations that meet client standards?
- Delivery Speed & Operations – Can we deliver at scale without burning out teams?
- Financial & Commercial – Are we actually making money on this work?
- Client Success & Growth – Are we keeping and growing our best clients?
Each of the 12 KPIs sits under one of these pillars, making it easier to build a dashboard layout in a spreadsheet or translation management system. Agency owners should be able to glance at the dashboard and immediately answer three questions:
- Are we delivering good work on time?
- Are we making money?
- Are clients staying and expanding?
Review cadence matters as much as the metrics themselves. Here is the typical rhythm that works for most LSPs:
- Weekly: Operational KPIs (quality scores, turnaround time, on-time delivery, post editing time)
- Monthly: Financial and sales KPIs (gross margin, revenue per client, MRR, average price)
- Quarterly: Strategic client success KPIs (retention, net expansion, customer satisfaction)
Quality KPIs: Are We Delivering Reliable Translations?
In a high-volume, MT-heavy world, quality KPIs are your main defense against rework, refunds, and reputation damage. When translation quality slips, you do not just lose revenue on the current project—you lose the client relationship and future referrals.
This pillar covers three core KPIs:
- Linguistic Quality Score (LQS)
- Terminology Consistency Rate
- Regulatory / Client Rejection Rate
The goal is to give you concise formulas and practical targets that an agency can realistically use in 2026 without expensive tooling. A simple spreadsheet or basic TMS quality assurance reports can capture everything you need.
Consider the impact: a medical device client who receives translated content with terminology errors faces regulatory rejection. That rejection delays their product launch and costs them money. They will not return to your agency. An e-commerce client who sees inconsistent brand voice across localized content will question whether your translation services are worth the premium. Quality issues destroy client retention faster than price increases.
Linguistic Quality Score (LQS)
LQS is a standardized score per project based on categorized error counts from QA reviews. Errors are classified by severity—critical, major, and minor—with different weights assigned to each category.
Formula:
LQS = 100 − (weighted error points ÷ total words × 10,000)
Many agencies aim for greater than 95 for client-visible deliverables. For regulated content like pharma or medical devices, target 97 or higher. For internal or high-volume MT-backed content, 90-95 may be acceptable.
Implementing LQS does not require complex tooling. Export error logs from your CAT tool or TMS QA module, categorize errors manually or through built-in MQM-based scoring, and calculate the score in a spreadsheet.
Example: A 15,000-word marketing campaign scores 92 in Month 1 due to 3 major terminology misuse errors and 10 minor punctuation issues. After glossary updates and vendor training, Month 2 scores 97. That improvement directly correlates with fewer client revision cycles.
Tracking average LQS by client, language pair, and vendor helps identify underperforming translators or machine translation engines before they damage multiple projects.
Terminology Consistency Rate
This KPI measures the percentage of glossary terms correctly used in delivered translations for a given client or domain. It directly impacts how professional your translated content appears to end users.
Formula:
Terminology Consistency Rate = (segments matching approved glossary ÷ total glossary-relevant segments) × 100
Targets for 2026:
- 95-98% for regulated and technical clients
- 90-95% acceptable for fast-turnaround marketing content
Capture this KPI using QA tools with termbase checks, or through manual sampling in smaller agencies. Review 10 pages per file if automated checking is not available.
Improvements in terminology consistency usually correlate with reduced human QA time and fewer client review cycles. When translators consistently use approved terms, your translation workflow becomes faster and cheaper.
Regulatory / Client Rejection Rate
This KPI tracks the percentage of delivered files that are formally rejected or sent back for major rework by clients or regulators. It is the most severe quality metric because rejections represent complete failures.
Formula:
Rejection Rate = (number of rejected projects ÷ total delivered projects in period) × 100
For highly regulated content (pharma, medical devices, finance), a 0-1% rejection rate should be the target. Rates above 3% are a serious warning sign requiring immediate investigation.
Example: A multilingual IFU batch for EU MDR submissions contains 40 files. One file is rejected due to terminology errors. That yields a 2.5% rejection rate—above the ideal threshold. Root cause analysis reveals the vendor team for Spanish-to-English was not properly briefed on regulatory requirements.
Review this KPI monthly with PM and QA leads. Link findings to training improvements, glossary updates, or vendor changes. Translation compliance failures in regulated industries can have legal and financial consequences far beyond the project cost.
Delivery Speed & Operational KPIs: Can We Deliver at Scale?
Agency profitability often collapses when translation turnaround time and workloads are not tracked. Teams work overtime, quality assurance gets rushed, and the translation process breaks down under pressure.
This pillar includes three KPIs:
- Average Turnaround Time (TAT)
- On-Time Delivery Rate
- Average Post-Editing Time (MTPE Efficiency)
These metrics show whether workflows, staffing, and automation are correctly tuned for typical 2026 client expectations. Many clients now expect same-day or next-day delivery for smaller jobs.
Operational KPIs should be visible daily or weekly to project managers and operations leads. When website localization sprints, product launch deadlines, or regulatory filing dates are at stake, delays ripple through the entire client relationship.
Average Turnaround Time (TAT)
Average TAT measures the mean elapsed time between receiving a client request and delivering the final approved translation.
Formula:
Average TAT (hours) = sum of (delivery time − request time) for all projects ÷ number of projects in period
Break TAT down by project types to spot bottlenecks:
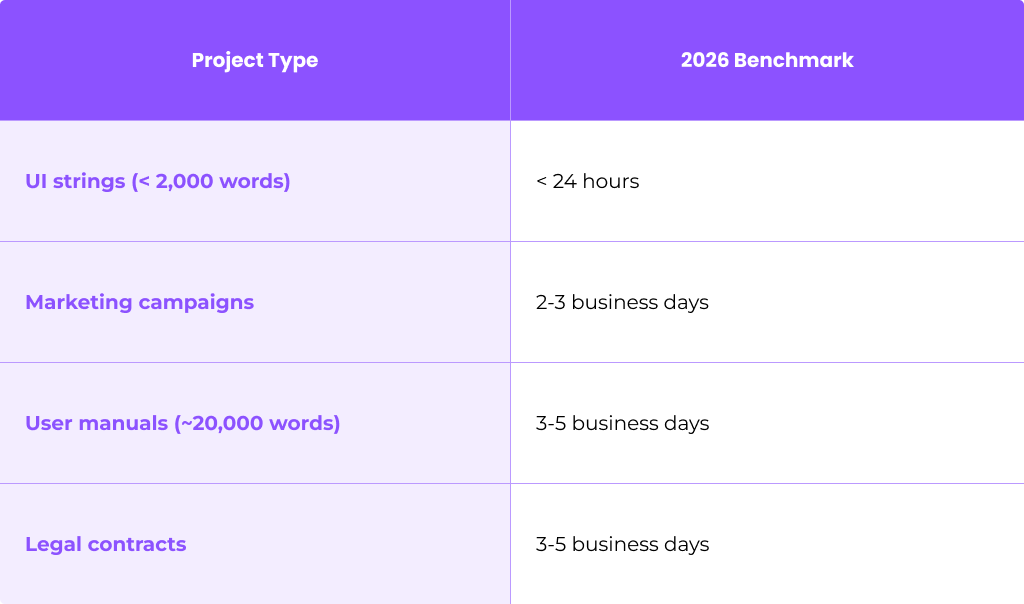
TAT trends over several months indicate whether hiring or additional automation through TMS, machine translation, or templated workflows is needed. If your average time keeps increasing month over month, capacity constraints are building.
On-Time Delivery Rate
This KPI measures the percentage of projects delivered on or before the agreed deadline, regardless of size.
Formula:
On-Time Delivery Rate = (number of projects delivered on time ÷ total delivered projects) × 100
Targets:
- Greater than 97% for standard workflows
- Greater than 99% for SLAs with penalties, especially in 24/7 or regulated environments
Some agencies track this metric and achieve impressive results. Public contract data shows that well-organized LSPs can maintain 99% on-time delivery, with 35% of projects delivered early.
Track this KPI from your project management system or even shared calendars for small agencies. The data source matters less than consistent measurement.
Consistent on-time performance is a top driver of client retention and referrals—sometimes more important than pure per-word price. Clients will pay a premium for reliability.
Average Post-Editing Time (MTPE Efficiency)
This KPI measures the average human time spent editing MT output per 1,000 words for a given language pair or content type. It reveals whether your machine translation investment actually saves money.
Formula:
Average Post-Editing Time = total human PE hours ÷ total MT words × 1,000
Benchmark ranges for 2026:
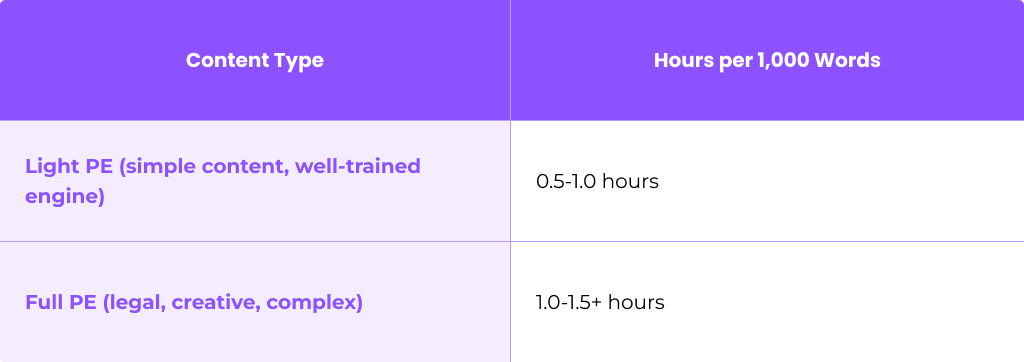
Track this KPI by engine and vendor to decide which MT models actually save money. If a particular engine consistently requires 1.5+ hours of post editing time per 1,000 words, it may be cheaper to use human translation from the start.
Gather data through timesheets, TMS time tracking, or simple start/stop logging. The average number of hours per thousand words tells you whether your localization efforts are operationally efficient.
Financial & Commercial KPIs: Are We Actually Making Money?
Many translation agencies focus only on total revenue or word count but ignore margins, cash flow, and client concentration risk. This creates a dangerous blind spot where high revenue masks low profitability.
This section covers four core KPIs:
- Gross Margin per Project
- Revenue per Enterprise Customer
- Monthly Recurring Revenue (MRR) from Contracts
- Average Price per Word / Hour
These KPIs help owners understand whether each segment—SaaS clients, life sciences, legal—is profitable enough to keep serving under 2026 pricing pressures. Track financial KPIs at least monthly, with quarterly reviews to adjust pricing and discount policies.
Gross Margin per Project
Gross margin reveals how much revenue remains after paying direct costs on each translation project.
Formula:
Gross Margin = (project revenue − direct costs) ÷ project revenue × 100
Direct costs include translators, editors, reviewers, MT/API fees, and vendor fees. Overhead costs like office space or management salaries are excluded from this calculation.
Good target range: 45-60% gross margin on standard projects. Rush jobs or strategic accounts may have lower margins, but these should be explicit decisions, not surprises.
Example project P&L:
- Revenue: €5,000
- Direct costs: €2,300 (translators, reviewers, MT fees)
- Gross margin: 54%
When repeated low-margin projects accumulate, they erode yearly profit even if total revenue looks healthy. Industry data from UK translation services shows average gross margins around 47.1%, with wide variation from 20% to 77% depending on specialization.
Categorize results by client and service line to identify unprofitable offerings quickly. Some content types simply cost more to produce than clients are willing to pay.
Revenue per Enterprise Customer
This KPI measures yearly revenue generated from each large account, including translation, localization engineering, DTP, and consulting services.
Formula:
Annual Revenue per Enterprise Customer = total billed to client in last 12 months
Segment clients into tiers to understand dependency:
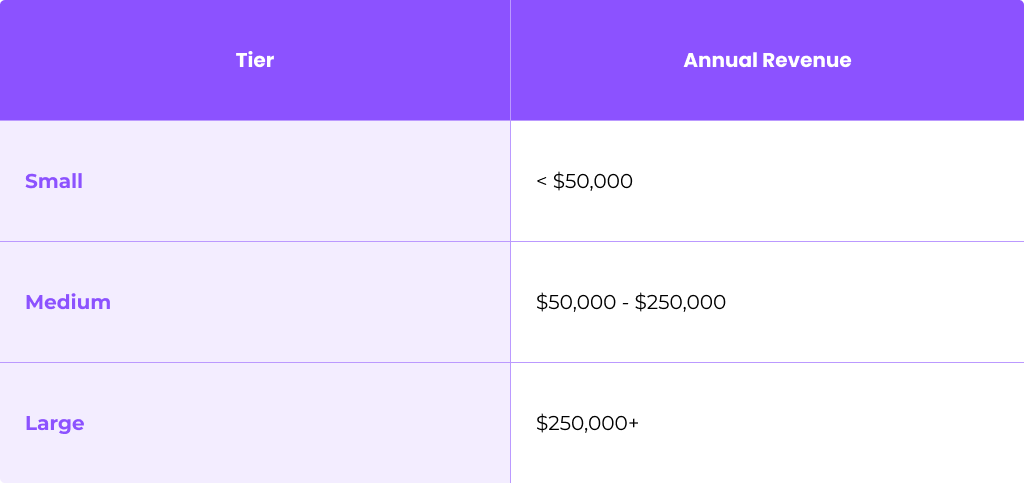
Example: An enterprise customer brings $80,000 in 2024. With additional languages and service bundles (MTPE + engineering), revenue grows to $200,000 by 2026. That expansion represents high-value account management.
This KPI also reveals concentration risk. If your top 3 clients represent 60% of how much revenue your agency generates, losing one could be catastrophic. The metric helps sales teams prioritize where to invest account-management time spent and upsell localization work.
Monthly Recurring Revenue (MRR) from Contracts
MRR represents predictable, contract-based revenue from retainers, subscriptions to translation packages, or minimum monthly commitments.
Formula:
MRR = sum of all active recurring contract amounts for the month, normalized to a monthly figure
Agencies with higher MRR are less exposed to seasonal swings and can plan hiring and tooling investments more safely. Predictable revenue enables strategic decisions about resource allocation and expansion into global markets.
Example: An LSP grows MRR from $25,000 in January 2025 to $60,000 by mid-2026 by converting ad-hoc buyers into retainer clients. That stability changes what the business can afford to invest in.
Review MRR monthly together with churn and expansion to project next-year cash flow. Track new customers acquired through contracts versus one-time buyers.
Average Price per Word / Hour
This KPI shows the blended average rate your agency effectively charges across all clients and languages.
Formulas:
Average Price per Word = total translation revenue ÷ total billable words
Average Price per Hour = total time-billed revenue ÷ total billable hours
Track this by segment and over time to see whether discounts or MT-driven rate reductions are silently eroding your pricing between 2023 and 2026.
The math is stark: A drop of only $0.01 per word across 2 million words removes $20,000 from annual profit. That translation cost erosion happens gradually but compounds quickly.
This KPI feeds into pricing strategy discussions about adding rush fees, minimum charges, or premium rates for high-risk content. Monitor whether each dollar spent on vendor fees and translation tools returns appropriate value.
Client Success & Growth KPIs: Are We Keeping and Growing Our Best Clients?
In 2026, it is often cheaper to grow an existing localization client’s spend by 20% than to acquire a brand-new account. Customer acquisition cost for new business typically exceeds the investment needed to expand existing relationships.
This pillar focuses on three KPIs:
- Client Retention Rate
- Net Revenue Expansion
- Customer Satisfaction / NPS
These metrics show whether your quality and delivery KPIs are translating into long-term relationships and referrals. Translation success ultimately means clients stay and grow.
Example narrative: A SaaS client starts with localization for 5 locales. Over two years, consistent translation performance and proactive account management lead them to expand coverage to 18 locales. That expansion happened because operational metrics were strong and the client trusted your localization strategy.
Client Retention Rate
This KPI measures the percentage of clients that continue to place orders or renew contracts over a given period.
Formula:
Retention Rate = ((number of active clients at end of period − new clients acquired during period) ÷ number of active clients at start of period) × 100
Target ranges:
- Greater than 85% annual retention for core B2B localization clients
- Greater than 90-95% for enterprise accounts
Track retention separately for enterprise and SMB clients, as patterns differ significantly. Customer turnover rate among enterprise clients has different implications than churn among small one-off jobs.
Sudden drops in retention should trigger reviews of quality incidents, price changes, or PM turnover. The customer acquisition cost to replace a lost enterprise client is substantial.
Net Revenue Expansion (Existing Clients)
This KPI shows how much revenue from existing clients grows or shrinks year over year, excluding brand-new accounts.
Formula:
Net Revenue Expansion = (revenue from existing clients this year ÷ revenue from the same clients last year) × 100
A figure above 100% means positive expansion through upsells, additional languages, or new content types—even if some churning occurs.
Example: Existing-client revenue of $1.2M in 2025 grows to $1.5M in 2026 from the same client base. That yields 125% net expansion, indicating strong account management and valuable insights into client needs.
This KPI helps justify investments in account managers, solution engineers, and client education programs. Reputation growth and localized content across more target market regions drive expansion.
Customer Satisfaction / NPS for Localization Buyers
This KPI combines structured survey scores with simple satisfaction ratings after big releases or quarters.
Net Promoter Score formula:
NPS = % Promoters − % Detractors
Target thresholds:
- NPS above +40 is considered strong in B2B translation services
- NPS above +50 indicates exceptional performance
Methods for 2026:
- Quarterly email surveys to localization managers
- Post-project feedback forms
- In-app CSAT prompts
A periodic qualitative question often reveals more than the numeric score alone. Ask: “What almost made you switch vendor this quarter?” The answers drive operational efficiency improvements like changing review teams or adding dedicated PMs for critical accounts.
Employee satisfaction among your internal team also correlates with client satisfaction. Burned-out project managers deliver worse service.
How to Build Your Translation Agency KPI Dashboard in 30 Days
LSP owners do not need a complex BI tool to start tracking KPIs effectively. A structured Google Sheet or simple dashboard in your translation management system can work perfectly well in 2026.
Step-by-step approach:
- Pick your 12 KPIs from the four pillars outlined above
- Define formulas clearly for each metric with specific calculation methods
- Assign data owners (operations, finance, sales) responsible for each metric
- Choose update frequency (weekly for ops, monthly for financial)
- Decide escalation rules when thresholds are missed (e.g., two consecutive weeks below target triggers review meeting)
Dashboard layout tips:
- Group KPIs visually by the four pillars
- Use conditional formatting (green/yellow/red) to spot quality issues quickly
- Include trend lines showing 3-6 months of historical data
- Keep monthly reporting simple enough that it actually happens
Start with the last 3-6 months of historical data from 2025 or early 2026 to establish realistic baselines. Your targets should represent achievable improvements over current performance, not arbitrary numbers from industry benchmarks that may not match your business.
Schedule a recurring 30-minute “KPI review” bringing together operations, finance, and sales leaders. The conversation matters as much as the numbers. Track improvements over time rather than obsessing over single data points.
Common Pitfalls in Translation Agency KPI Tracking
Even experienced LSPs frequently misapply KPIs, creating perverse incentives that harm the business they were meant to help.
Common pitfalls to avoid:
- Tracking too many metrics: Dashboard overload leads to paralysis. Twelve is enough. Start lean.
- Focusing on outputs, not outcomes: Total words translated looks impressive but reveals nothing about profit or client satisfaction.
- Ignoring data accuracy: Inconsistent error definitions, mismatched time zones, and missing entries make KPIs unreliable.
- Failing to assign KPI ownership: If no one is responsible for improving a metric, it will not improve.
- Optimizing individual KPIs while harming overall profit: This is the most dangerous trap.
Example pitfall: An agency aggressively cuts vendor rates to improve the gross margin KPI. Six months later, linguistic quality scores drop, translation error rate increases, and client retention falls. The margin improvement was an illusion—total revenue generated declined because clients left.
Review your KPI set annually to ensure it still matches your 2026-2028 strategy. The right KPIs for a generalist agency differ from those for a specialized medical translation firm. Business goals evolve, and kpis related to those goals should evolve too.
A lean but well-understood KPI set is better than a large dashboard nobody reads. Tracking kpis effectively means acting on them, not just collecting data.
Conclusion: Turn Your KPI Dashboard Into Daily Decisions
The 12 KPI framework gives translation agency owners a practical way to connect production, finance, and client success into a single view. Instead of guessing whether your localization process is profitable, you can see the numbers.
Consistent weekly and monthly reporting matters more than perfect formulas. The trend lines and conversations drive change—not the precision of your calculations. When your team discusses why on-time delivery dropped 3% last month, improvements happen.
Start with a minimum viable dashboard featuring the most critical KPIs for the next quarter. Gross margin per project and on-time delivery rate give you immediate visibility into profitability and reliability. Add quality and client-success metrics as your data discipline matures.
Audit your existing metrics and design a 2026-ready KPI dashboard tailored to your mix of clients and services. The agencies that thrive in compressed-margin environments are those that know exactly where their translation output creates value—and where it does not.
FAQ
How often should a translation agency update its KPI dashboard?
Update operational metrics weekly: quality scores, turnaround time, on-time delivery rate, and post editing time. Financial KPIs like gross margin, MRR, and revenue per client work better on monthly cadence. Larger agencies may add quarterly strategic reviews focused on client retention and net expansion. Daily tracking is rarely necessary except for high-volume or 24/7 teams where live TMS dashboards help. Keep the cadence realistic so updates actually happen at fixed intervals.
What tools are best for tracking translation agency KPIs?
Many agencies start with spreadsheets plus exports from their TMS, invoicing system, and time-tracking tools. More mature LSPs use BI tools like Power BI, Looker Studio, or Tableau connected to their TMS and accounting data. The best tool is the one your team will consistently update and review—even if it is Google Sheets in 2026. Define data owners for each KPI so AI tools and manual processes both feed current information into a single source.
How do I set realistic KPI targets for my agency?
Start with historical data from the last 6-12 months to establish baseline values for each KPI. Set targets as modest improvements: 10-15% better TAT, 5-10 percentage point gains in on-time delivery. Industry benchmarks from associations can help, but your mix of languages, content types, and client sectors will influence what realistic looks like. Review targets annually as technology, client mix, and pricing in your target market evolve.
Should I share my KPIs with freelance translators and vendors?
Share relevant kpis for translation work—quality scores, on-time performance, post editing time—with vendors to support transparent collaboration. Detailed financial KPIs like gross margin can remain internal while you still communicate expectations around quality and turnaround. Regular feedback based on kpi measures helps translators align with agency standards and participate in continuous improvement. Use neutral, constructive language so KPIs feel like coaching tools, not punishment.
What is the first KPI I should track if I’m just starting out?
Start with gross margin per project because it quickly reveals whether you are pricing correctly and covering direct costs including translation cost and vendor fees. Pair this with on-time delivery rate for an immediate view of both profitability and reliability. Once these two metrics are in place, progressively add quality and client-success KPIs without feeling overwhelmed. Treat this as an iterative process—your key kpis will mature as your data discipline improves and you generate valuable insights from the numbers.
Table of Contents
- Why Translation Agency KPIs Matter in 2026
- The 4 KPI Pillars for Translation Agencies
- Quality KPIs: Are We Delivering Reliable Translations?
- Delivery Speed & Operational KPIs: Can We Deliver at Scale?
- Financial & Commercial KPIs: Are We Actually Making Money?
- Client Success & Growth KPIs: Are We Keeping and Growing Our Best Clients?
- How to Build Your Translation Agency KPI Dashboard in 30 Days
- Common Pitfalls in Translation Agency KPI Tracking
- Conclusion: Turn Your KPI Dashboard Into Daily Decisions
- FAQ
Ready to manage your Translation company easily?
Get Started for Free